My Motivation for the Project
I spent about a year after graduating with my Chemical Engineering degree working with my father on developing a patent on a new drying process. More recently, my parents have spent the last couple of years trying to launch a company based on a new technology they developed. I have experienced firsthand the difficulties in securing a patent and communicating its value, and secondhand the difficulties in securing funding for a new, unproven technology.
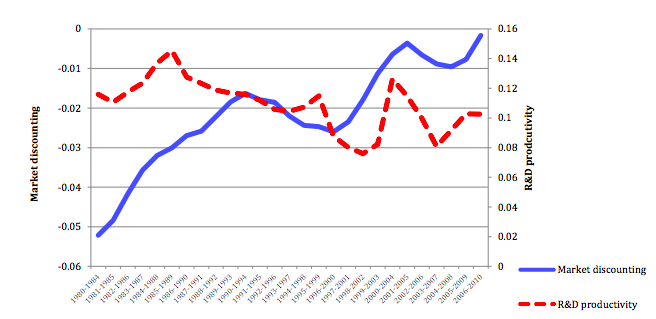
Companies, and in turn, investors, have become more and more short-term oriented as time has gone on. This has resulted in decreased R&D spending, and thus decreased innovation as companies place less value on long-term investments. This is due in part to the fact that it is difficult to quantify innovation, and thus put a value on it. In an increasingly numbers-focused world, where every decision needs to have quantifiable metrics to back it up, putting a dollar value on patents, and thus research, would go a long way in correlating Research to real-world value.

This is a graph from this paper, I think it drives home the point of this exercise, which is to apply a value to innovation in order to encourage long-term thinking, and allow companies to justify R&D spending.
Project Info
This is a notebook which runs through the project step-by-step as a whole.
Data was obtained from Google’s Patent Data hosted on BigQuery.
Initially, my goal was to create a model which would predict the value of a given patent, by building a regression model around ground-truth values which were obtained from this paper.
However, I eventually found that I could not correlate the patent metadata strongly enough with the ground-truth values to justify predicting the exact value of any given patent.
Despite this, the project was still very useful for visualizing which companies have put out the most valuable patents, and comparing across companies based on relative innovation value. By correlating this with R&D spending, companies could use this data to ballpark return on investment. Furthermore, I was able to determine the most valuable patent topics, to a certain degree, which allowed for an easy visual comparison on a technology basis.
This project would be valuable to companies looking for their next move, or at least looking to put a ballpark value on a given technology or investment. While this does not solve the problem I posed in the beginning, it certainly helps.
The presentation containing all of the visuals I created in tableau, as well as a general narrative is available here
The video of my presentation is located here. This is from the livestream of presentations given on our final projects at Metis.
My presentation starts at ~17:45
Any questions feel free to contact me at nicolas.giraldowingler@gmail.com
Some interesting Results

This bubble chart shows the most valuable companies relative to each other by the value of their patent portfolios. This and all following charts were created in Tableau:

These are the most valuable patent topics, or technologies, overall.
The reason chemical patents came out on top instead of tech patents despite the recent explosion in number and value of these patents, is that the tech field is more fragmented in terms of topics.
More topics means smaller blobs, but as an aggregate they are the most valuable.
Still interesting to note is that before tech, most of the money was in chemical manufacturing, especially in coatings and adhesives.

After removing the top chemical topics, the tech field comes out. As expected, the most valuable topics pertain to Chip manufacturing, Sensors, and Wireless Communications.


Leave a comment